This review was sent to and posted on the Dailyprofit website last week. You can see it and all the comments on that page.
I thought you would like to see the detail I like to go into when judging a service, and I hope this gives you an inside peak at one part of the service. Over the next week I will review the Value and Risk free part of the service and also write about my 1st year of running a service from a business perspective.
Dailyprofit 1st Year Review
We have now just completed our first full year of service and over the next week we will break down all the results. Today we start with the pure gambling side of the service. These are the picks provided by Sportpunter. Sportpunter is the world’s top tipping service and has been providing profitable models online for over 12 years. Dailyprofit teamed up with Jonno (who owns Sportpunter) to allow the regular punter to also benefit from his amazing models.
My belief was that the models were so good that even after all his professional clients placed their bets and drove the prices down, there was still enough value to make between 2-5% profit each year. Like any market (financial or betting), prices fluctuate and usually rebound after one side has been hit hard.
So has my idea worked? is there still profit in these models after the big bettors have had their fill? We find out below (Hint: yes there is).
Sportpunter bets 4 July 2014 – 4 July 2015
The service begun on a cold and windy night in a forest overlooking the mountains of the Serengeti. To be more specific (and honest), it started on the 4th of July 2014 from my office while I was sat in my underwear. This was just a random date and we were half way through a number of sporting seasons. We started advising bets on the NRL, AFL & Super 15. The service started out as one only for Australians and I had no plans to offer any other sports. These 3 sports were easy for Australians to bet on, the fact I was betting line bets also meant the variance would not be massive and the past returns had been very good.
The goal was to make this service the simplest, cheapest and yet the best service for the small time punter. I felt all they wanted to do was place a few bets on the weekend to have an interest in a few games and make some profit at the end of the season. I was proved wrong.
After the initial early success of the service, I was inundated with requests from people all over the world who also wanted a piece of the Sportpunter service but couldn’t afford the subscription cost there. I was not so sure about offering the American sports (NFL, MLB, NBA & NHL) as part of the service, but I realised that if I did not then there would be 4-5 month periods of no bets. This would mean the service would be seasonal and I would only make money during the footy season (and would have to double the price to achieve a worthwhile profit).
After looking at the past results of these sports and price movements, I decided that there might be a little profit to still be made. It would not match the returns of the Australian sports, but a lot more could be bet on the American ones. So 3 and a half months into the service we started advising NFL bets, followed later by NBA and NHL and eventually the MLB.
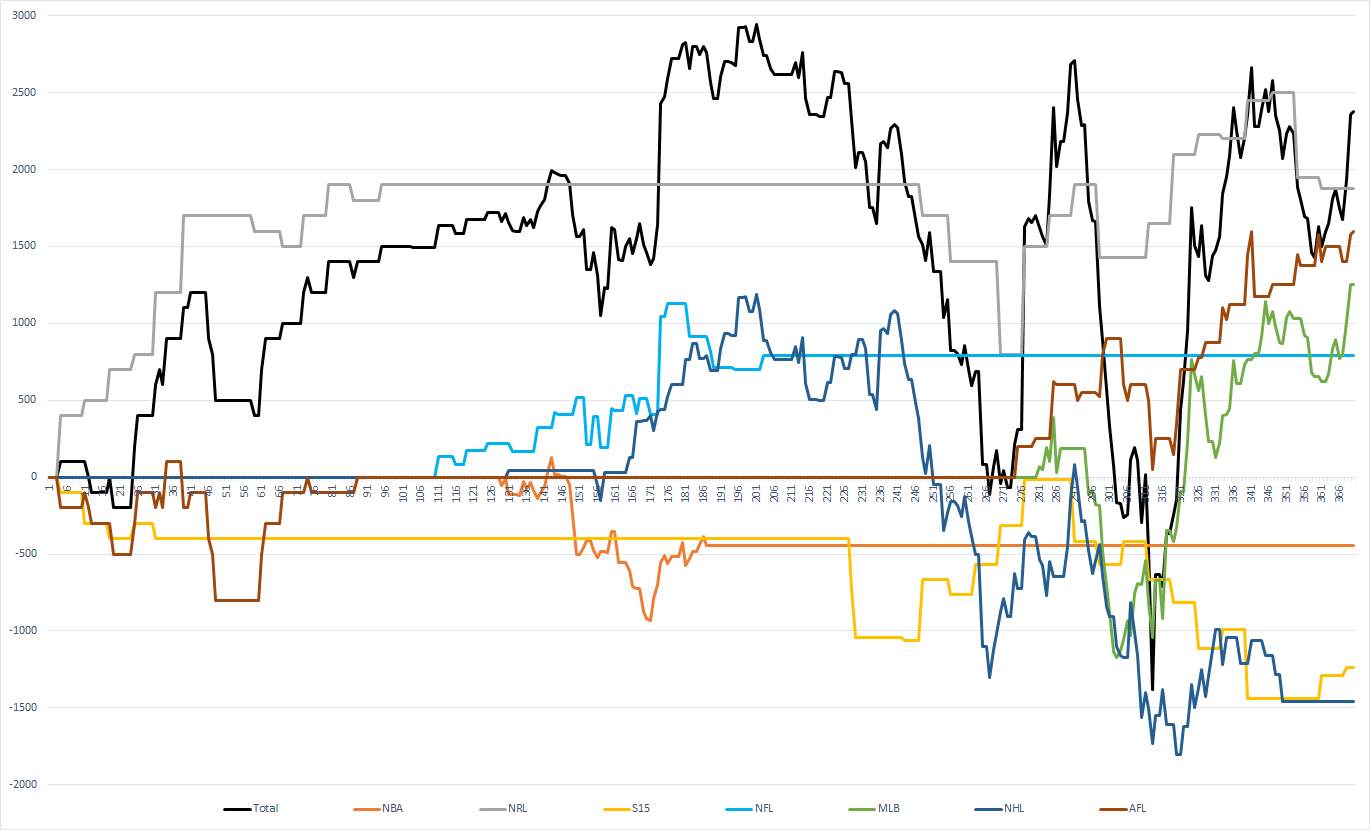
The graph below does look complicated, but bear with me as I try and explain what you are looking at. This is a high level overview of the results of our first year. It has the total profit graph (in Black) and also each sports results in varying colours (look at the legend at the bottom of the graph to see which colour matches which sport).
As you can see at the start of the graph, there is the Black line which is the total profit and loss, but also a Gray, Yellow and Brown line. These correspond to the NRL, Super 15 and AFL bets. A Light Blue line starts about 110 days into the service which is the NFL model, followed quickly by an Orange (NBA) and Dark Blue (NHL) line. Finally at around day 275 you see a Green line which is when the MLB season started.
On the graph you also see lines that have long stages of straight lines, for example you can see the NRL Gray line that stops on day 96 and starts moving again on day 250. This is simple because the NRL season ended during that period of time. You will see the same for the other sports.
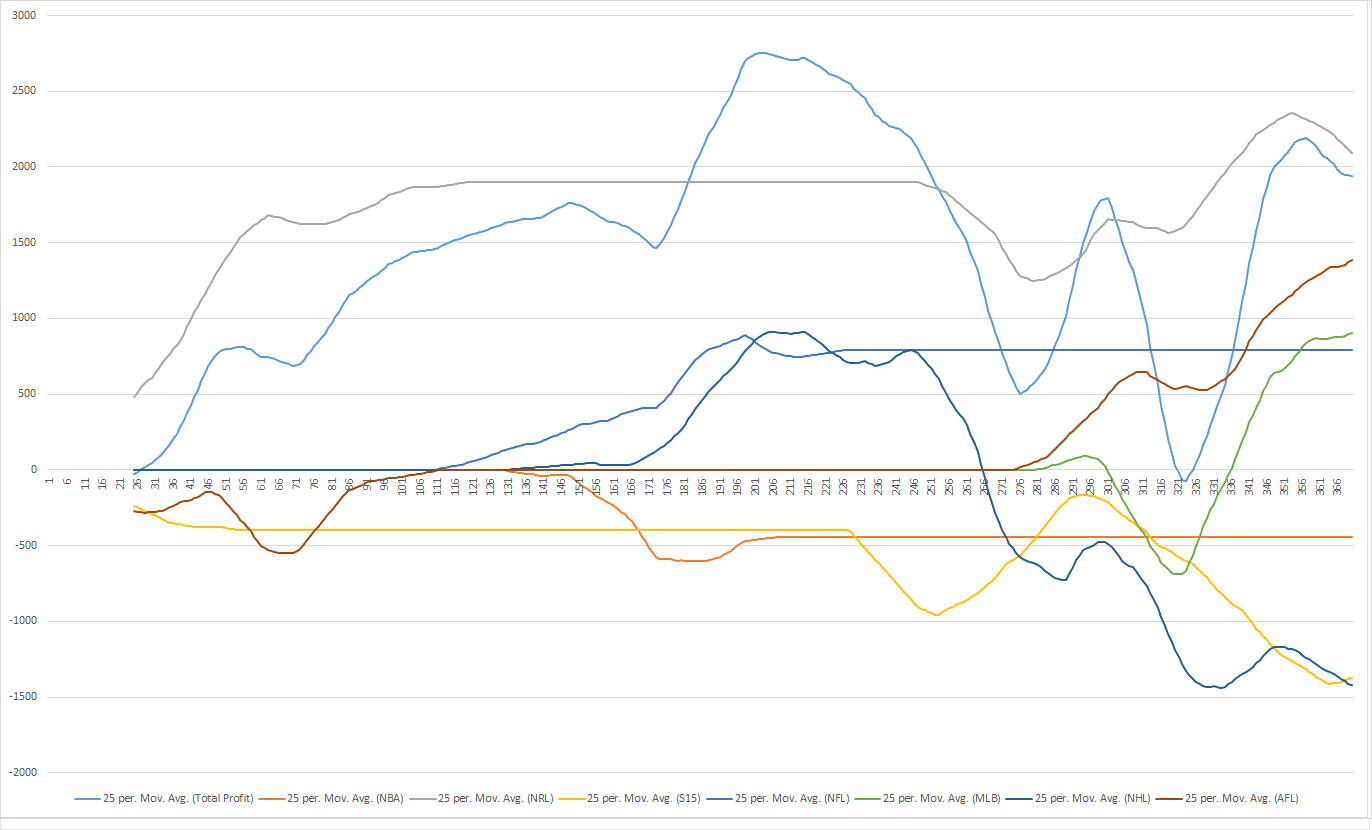
I hope that isn’t all that complicated. Below is the same graph but with a rolling 25 day average which makes the graph a little easier to decipher.
How I recorded odds
Now before we delve too deep into the review, it’s important to know how the odds were recorded. What’s the point of all these numbers if you have no chance of matching them. The recording of odds is one of the many ways a tipster can hide his real performance. Most simply list the highest possible odds from all bookmakers at the time of release. Others are a little better and choose the best odds from a list of bookmakers who will allow bets on. This is a little fairer once more but still does not go far enough.
In my mind it’s pretty simple. My results should match or be worse than my members. What you see on my results page should be the bare minimum you can expect to make. This is where Dailyprofit stands out from every other tipster. I make my results as bad as possible, and I do it for a very specific reason.
The reason is simple, I love to delight my members. By the time they get to my service, many have been through others and are cautious of any tipster. They have been lied to so many times by other tipsters they no longer believe anything they are told. They join this service, and find with a little effort that they can match or beat the quoted and recorded odds and they can’t believe it. I under promise and over deliver.
My results also weed out customers I do not want. The guys who expect to make a heap of money by chucking a few bets on each weekend. These guys are more hassle than they are worth and by showing a low return, they believe the service is not worth their time and move on. I’ll let these guys continue to pay the dodgy tipsters who lie about results and lose customers money.
AFL, NRL & Super 15
We record these based off the line at Topsport. These are $2 lines and are also offered at 2 other bookmakers. We record these lines just after the main Sportpunter members have bet and usually at their lowest. If a member waits until later in the day, 90% of the time they will get much better lines. Another option that many members take is to find an improved line at slightly lower odds from the many other bookmakers. Lazy members simply bet at the moment the email is received and at worst will match the official results. We have recorded a few bets that lost by half a point where most members were able to get a better line and won the bet.
American Sports (NFL, MLB, NBA, NHL)
For most of the year I simply recorded at the Pinnacle price at time of release. This was one of the worst possible prices in the market as most of the big Sportpunter bettors bet at Pinnacle and crush the line. By the time I release the plays, there has not been enough time for them to rebound. I have now moved to quoting the best price from either 5Dimes or Pinnacle. With minimum effort, members should beat these odds time and time again. Every extra cent better odds adds up over a season. Quoting the way I do, I expect most of these models to achieve a 0-2% ROI. By finding the better odds, members can easily increase this to a 2-5% return.
So that is how I record odds, not only at the worst possible time, but also at only 3 bookmakers. You will not find any other service where prices are this achievable (and beatable)
Shut up Steve and tell me how you went. Fine, I will.
We advise all members to have a starting bank of 40 units and our records are based off a $4,000 bank which means 1 unit is $100. Our goal each season is to make between 20-40 units profit. This means we hope to make between 50% and 100% bank growth each year.
That’s no easy feat. If that same $4,000 bank was invested in stocks, a return of $400 (4 units) would be seen as an amazing year.
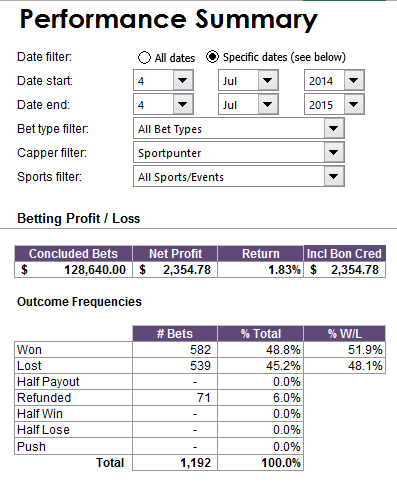
In our first year we turned over our $4,000 bank 32.16 times. In total we bet $128,640.00 (1,284 units) and we made a profit of $2,354.78 (23.54 units). That was a 58.87% return on our initial bank. That is within the expected range but at the lower end. But if you remember above about the odds quoting, this result could have been very easily beaten with effort by the customer.
In my eyes this year was a success, being the first year I made a few mistakes with the staking and these will improve each year, but anything over 50% return is an amazing performance in my books.
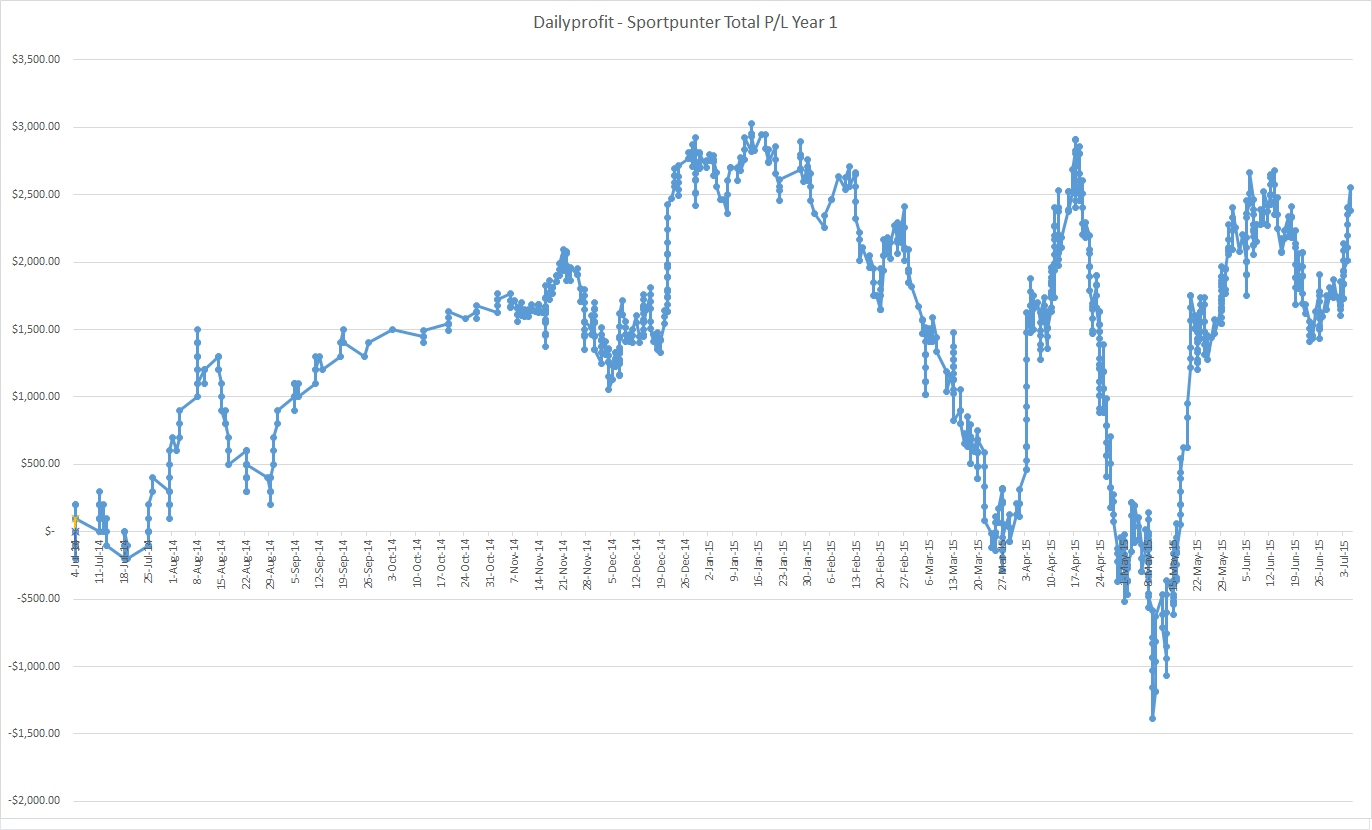
But that does not paint the whole picture of the service. Betting is not as simple as waiting for an email and placing bets and sitting back and enjoying the profits. Betting is a wild ride, especially if you followed every model. Take a look at the graph below. This is the total profit graph of the 1st year.
We see a very nice start from July to November (as we were betting Aussie sports only), but once we introduced the American sports, we also welcomed our friend variance. As we will see later on, there was one sport which had a massive impact on our results. My hopes by offering bets in the $1.80-$2.20 range was that the variance would not be as large as we see on the graph below. But sadly with betting, we will all see losing and winning runs. 80-90% of the time we will actually be below our peak profit level, and this affects many small time punters.
This also affected many Dailyprofit members. After that amazing run up to $3,000 profit many new members joined the service. As is the case with betting after a great run, a loss is just around the corner to even things out. Most small time punters can’t deal with short term losses and this is what keeps them as long term losing punters. I would say 100 new members came and went during that 3 month losing period. We still had just over 200 members who had the mental fortitude to stick out a bad run and they were rewarded with massive profits in the next month. This was again preceded by another major fall and once again immediately by another quick rise. These massive movements up and down are not fun, but it is a fact of gambling. Winning runs and losing runs happen and we have no idea when each will be. I do not expect as wild swings in year 2 but that does not mean we will not see them again.
If members had stuck to their banks they would have been fine, apart from any member who joined on the 18th of April (I checked, no one did). I did not expect the variance to be as large as it has been, but my initial bank size was based only off the Australian sports. In future I will be advising a 50 unit bank for new members.
So that is the high level review done. A very healthy profit was made after a very wild ride. We will now break down each sports results in more detail. By doing this we can see where the strengths and weaknesses are and can create our own mini portfolio of sports to follow that suit our own style of betting.
AFL
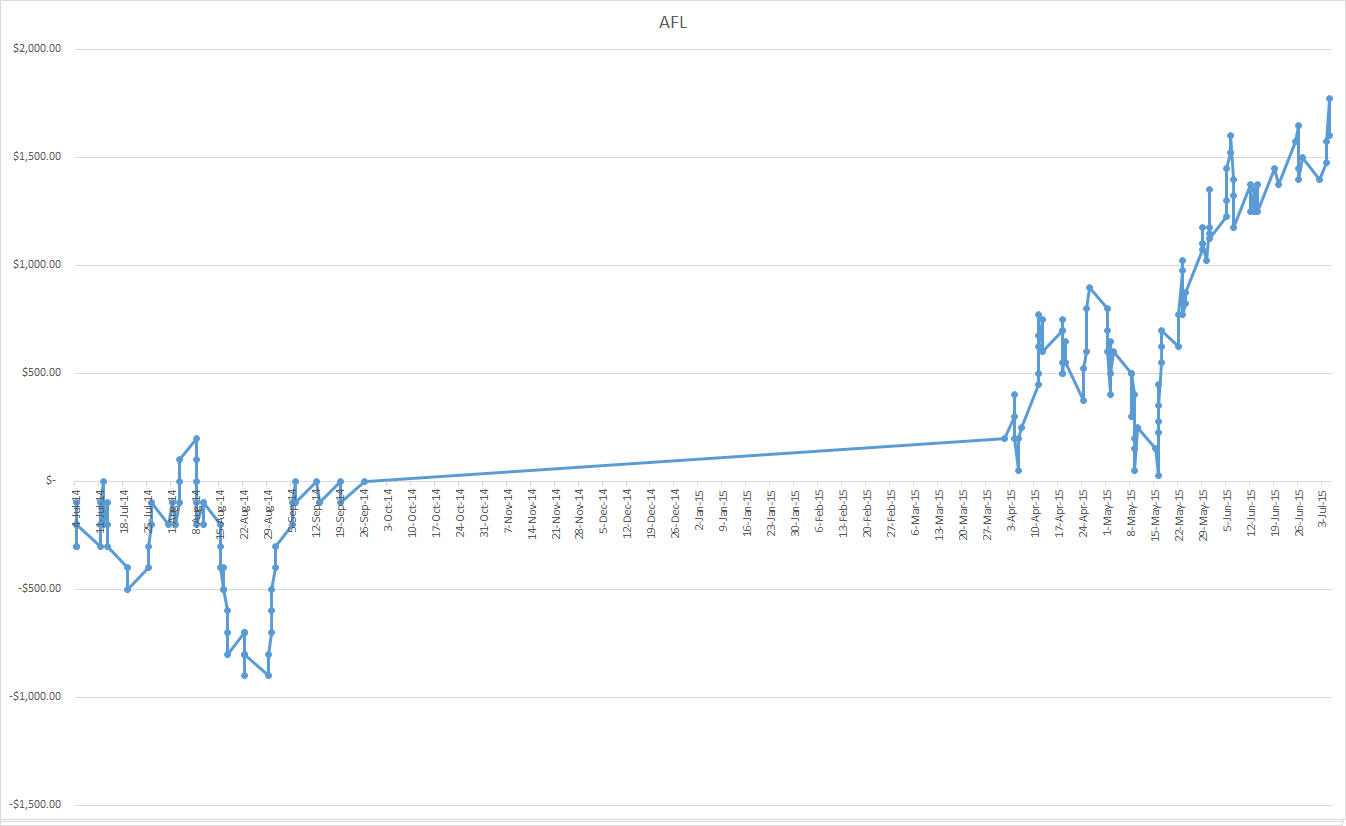
The first ever advised bet for the service was on the AFL so we will start here. I believe the Sportpunter AFL model is the world’s best model. It has consistently made a huge return year after year over more than a decade.
When I first started the service I believed that flat betting was the fairest way to go. So if you look at the graph below you will see the period from July to September. All bets were of equal size (1 unit). In our second season of AFL which started in April I moved to differing stakes depending on the overlay that Sportpunter produced. Flat staking was a mistake I made when starting the service and this has now been rectified.
That first period ended with 50% of bets winning and $0 profit. What we want to look at is this current season as we are using variable staking. Stakes can be from 0.5 to 3 units. The 0.5 unit bets are the ones with the least confidence and any 3 unit bets are ones where the model believes overwhelmingly that it will win.
This means if we break these bets down we should see a better return from the bigger bets than the smaller ones. We will also see how we would have gone if we were flat staking the entire time.
Before we do all that, let us look at the results as they stand. We placed 183 units and made a profit of 15.75 units. A return of 8.57%.
![]()
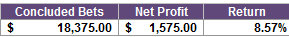
That is an amazing return and I do not expect it to stay that high. I believe long term the Australian sports should be able to hit 5% ROI.
We can now look at how we would have done if we simply flat staked all the bets. That means every bet was of equal value and we bet 1 unit on each bet. There were a total of 155 bets over the past year. We had 71 losing bets and 84 winning ones. The difference is 13 units which means if we were flat staking we would have made 13 units ($1,300) profit. We did just a little better. Let’s look at the current season results.
Please note: when looking at such small sample sizes, data has very little statistical significance.
So far this season we have placed 85 bets and had 36 losing bets and 49 winning ones. If we were simply flat betting 1 unit per bet we would have made 13 units ($1,300). Instead we did a little better and made 16 units profit ($1,600).
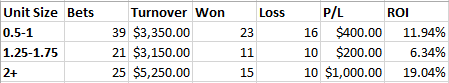
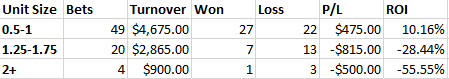
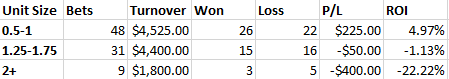
In the above graph I have broken down the bets for this current AFL season into 3 samples. The lower level bets (those between 0.5 and 1 unit), medium level (between 1.25-1.75) and high level (bets 2 units and above). What we should hope to see is that as the unit size increases and therefore the models confidence increases, we should see a corresponding increase in the ROI. While not exactly what we want to see (as the 1.25-1.75 bets produced the lowest ROI), but we see that the majority of the profit is from the higher confidence bets. Although I will happily take an 11.94% ROI on those lower confidence bets.
What this shows is that variable staking seems to be working well for us.
I will give the AFL model an A+
Super 15
The Super 15 bets are similar to the AFL bets, we started with flat staking and this season have moved to variable. Sadly the results have been very poor. This is one model I feel can be greatly improved in the future by moving to a player based model. Jonno is moving most models from team based to player based and I’m sure next season this one will also move from team to player based.
![]()
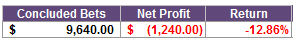
We bet 96.4 units and lost 12.40 units for a -12.86% ROI over the past year. As you can see by the graph, this season just past started well and then feel into a heap.
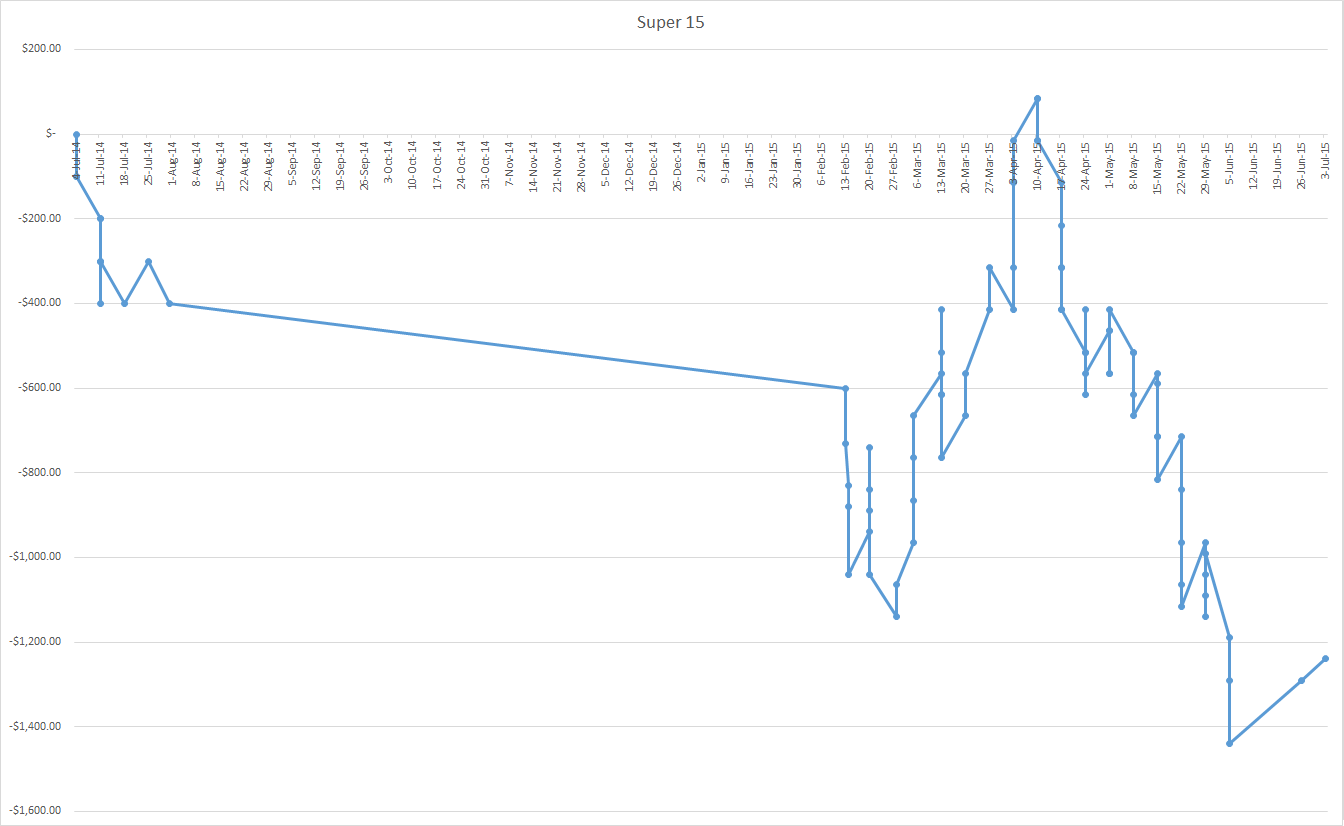
We will once again only look at this seasons results (Feb 2015 – July 2015) as that is when we moved to variable betting. We had 73 bets which saw 35 wins and 38 losses. If we were flat staking that would have resulted in a 3 unit ($300 loss). Instead we lost 8.4 units ($840). That leads to the simple conclusion that variable staking did not work well for us this year.
There is not as much data here and nothing much can be inferred. I believe moving to a player based model will see this move into profit next season.
I will give the Super 15 model a D
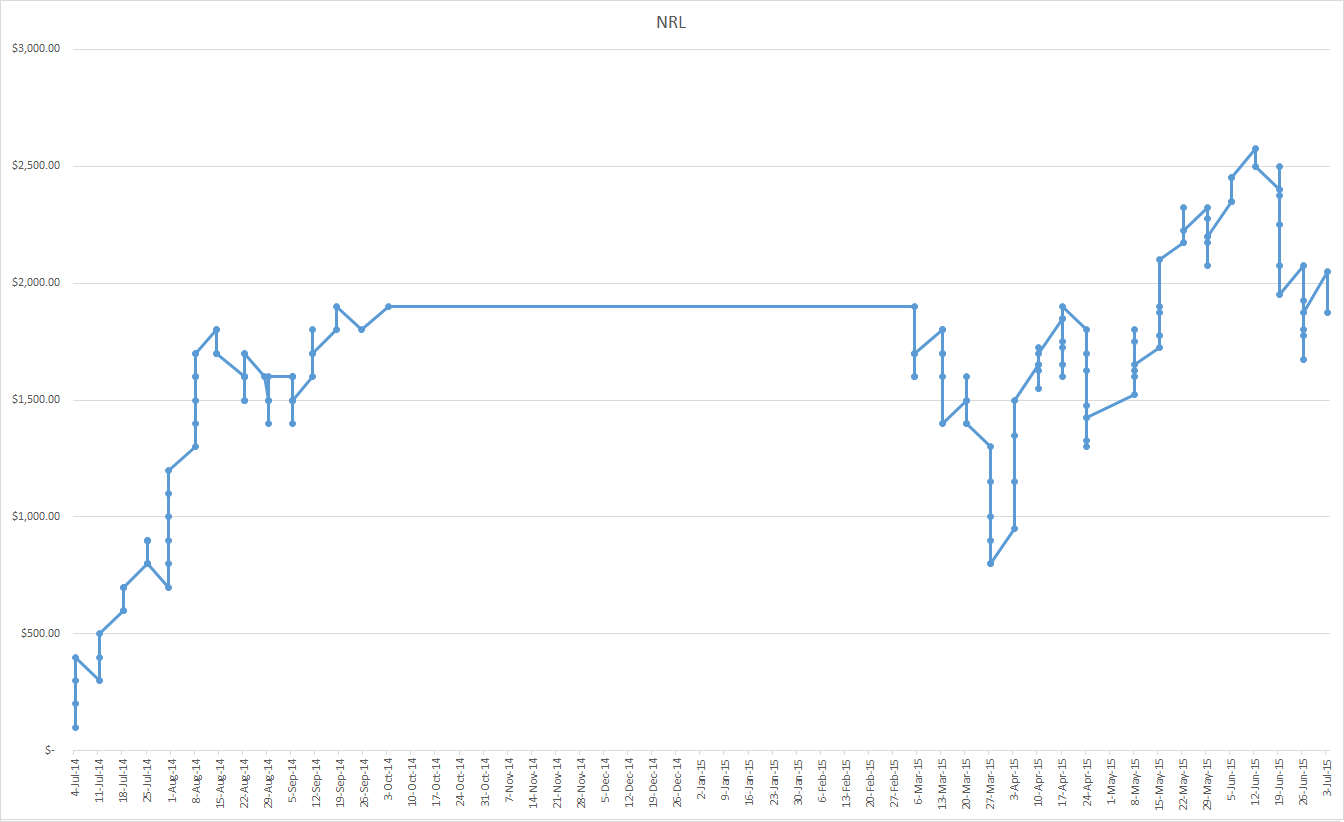
NRL
Onto the last of the Aussie footy codes and another good performance. This has even outperformed the AFL model. Just like the other two codes, we started flat staking and have now moved to variable staking. Over the last 365 days we have bet 169.25 units and made a profit of 18.75 units at 11.08% ROI. Another amazing result.
![]()
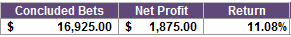
Let’s break down this seasons variable staking and see if it has been working well for us. In total for the 2015 season we have had 88 bets, 43 losses, 44 wins and 1 push. At level stakes that would have returned 1 unit ($100) profit. With variable staking we have lost 2.25 ($225) units.
Another case of not enough data. It looks similar to the Super 15 results, but when we are looking at just 9 bets, we can’t assume anything. Hopefully this time next season we will have enough data to make a proper conclusion.
I still feel the NRL model is very good and give it a B
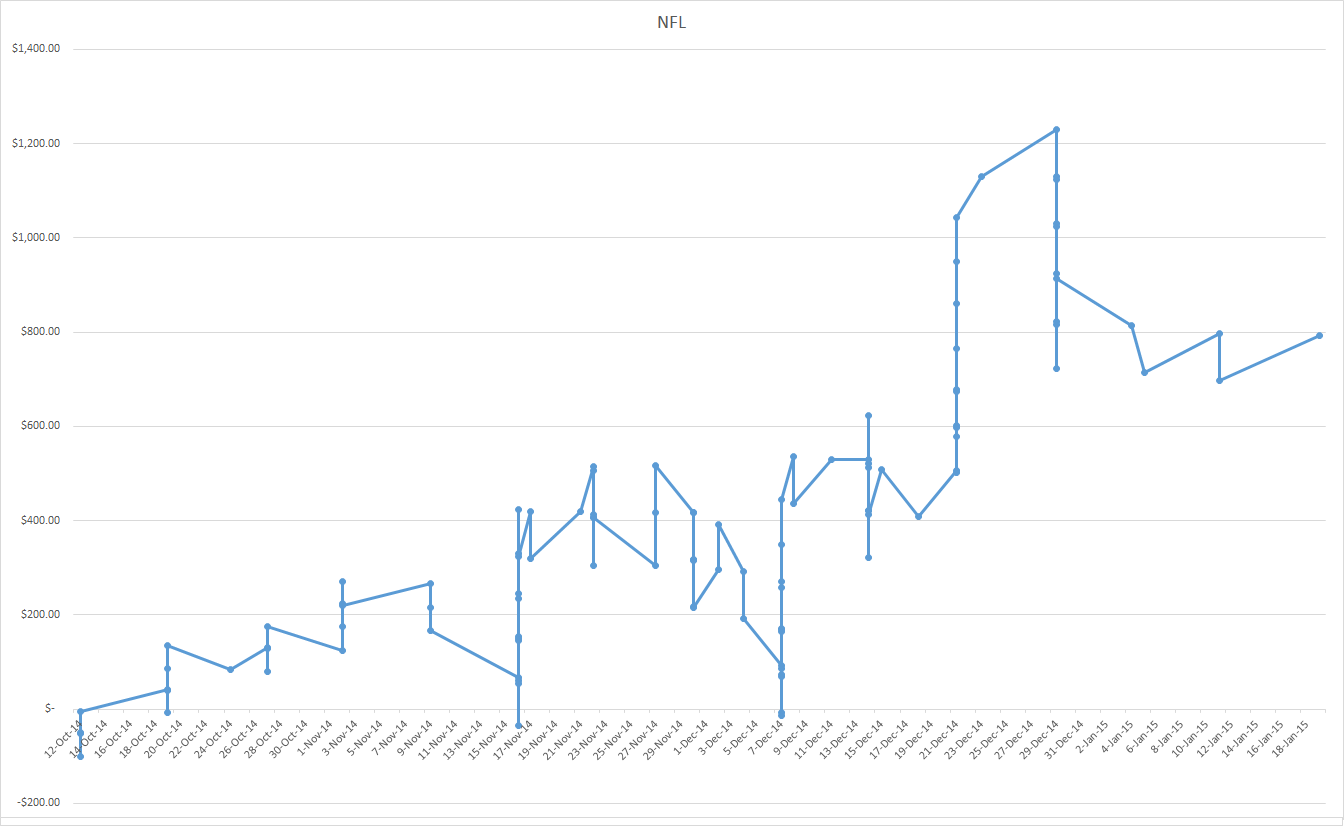
NFL
Wow, this is a long post. I’ll push through the american sports with just the basic numbers and have my conclusion on them together.
![]()
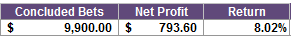
We placed 110 bets on the NFL, won 61, lost 48 and had 1 refund. Stakes were either 0.5 or 1 unit as I had not fully gotten my staking right at this stage. In total we bet 99 units and made a profit of 7.93 units at 8.02% ROI. I believe with better variable staking we will see increased profit next season.
This is one of the only American models I have any confidence in.
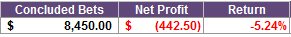
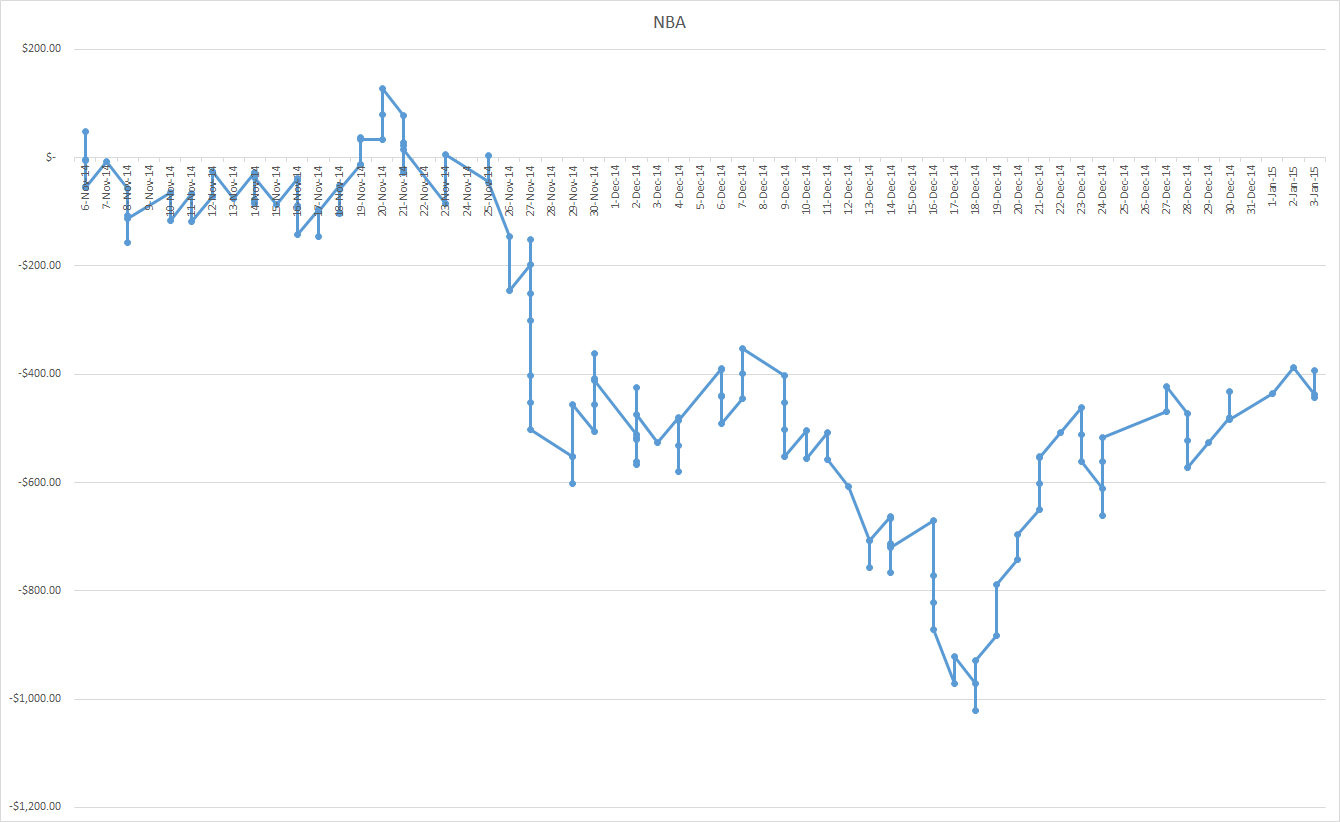
NBA
We only had 2 months worth of NBA bets. I kept going back and forth if I should advise bets on these markets as Sportpunter clients usually took all of the value and the lines never seemed to rebound. Eventually I gave into members who wanted them. We bet 84.5 units and lost 4.42 units at -5.24% ROI.
![]()
The NBA model is very streaky and usually performs well all the way up to January and than falls of a cliff. This has happened nearly every season. There is nothing that can explain why this happens, but it continually does. I will once again have to think carefully about how (if at all) I will advise NBA bets next season.
NHL
This was the killer model. It just never felt right all season. 95% of the bets were on the over. There was a lot of talk in the SP forum about this model acting very strange. This has been the most staked model of them all with 388.25 units bet for a 14.6 unit loss. Because of the large turnover the ROI is only -3.76%.
![]()
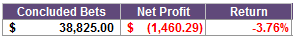
I’m sure Jonno will be looking into this model next season and improvements will be made.
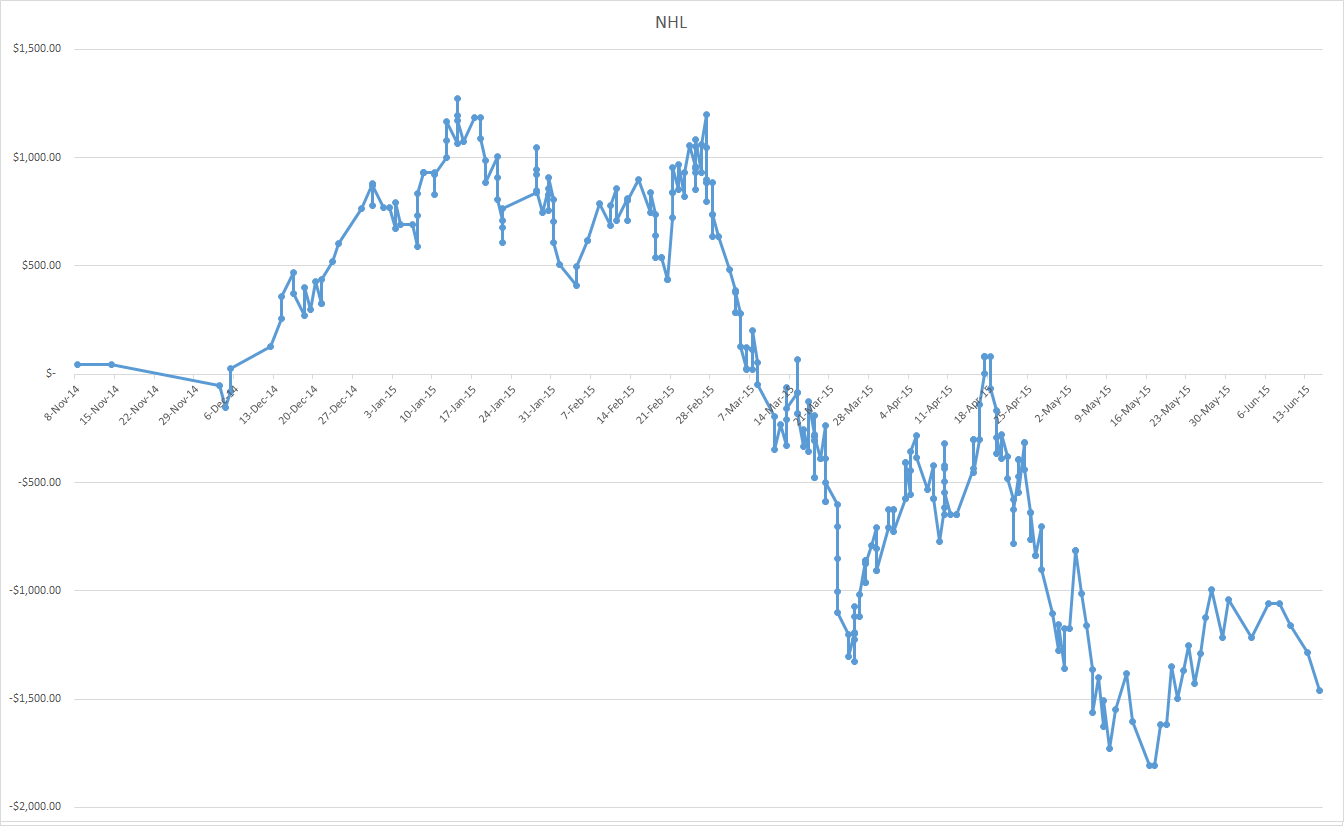
MLB
This is the only American sport we are currently betting. The other 3 are in their off season. Results have been pleasing. We have bet 265.25 units and made 12.54 units profit at 4.73%.
![]()

MLB will offer the highest turnover of any of the models and if we can return between 2-5% ROI over a season that will see a healthy profit added to our bottom line.
American sports notes
As with all the American sports, I believe members can beat the quoted odds at least half the time which will equate to much better results. While I believe the NFL and MLB should do ok, and by being very selective we can make a profit on the NBA, I am unsure about the current NHL model. Now this might be easy to say in hindsight, but I had the same reservations when I started offering American sports.
For a fair bit of work (MLB,NBA, & NHL have games daily) there is not all that much return. High turnover and low return is how I have made my living from betting but Dailyprofit is more for the smaller punter. I’m still undecided if the American sports are really worth the hassle.
How I would use the service?
To put it bluntly, I’m a pretty lazy bettor. I hate looking for best odds and having to be at the computer at a certain time. I make the effort more so now because it has become routine and at my current stakes a healthy profit can be made each season. But if I had a bank $10,000 or under I would use this service very differently.
I would want the fewest bets for the highest ROI. I wouldn’t want to bet every day, instead I would prefer to place bets just on the weekends.
I would only follow the AFL, NRL, S15 and NFL models. Now once again, in hindsight these are the best models (apart from S15, and not taking into account the MLB). By just following this portfolio you would have turned over 548.40 units and made 30 units profit at 5.47% ROI.
This is low stress, fairly low variance and high return on investment.
Conclusion
Overall I think this first season was a pretty good one. Not spectacular, but anytime a profit can be made from betting over a whole year means we must be doing something right. Year 2 will be interesting and I feel a few improvements can be made on the American staking.